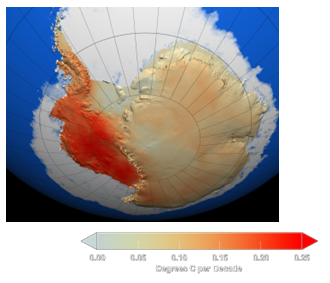
Figure 14. This NASA image shows the extensive warming of the West Antarctic ice-sheet surface inland of the Antarctic Peninsula. This warming is significantly higher than previously reported, exceeding 0.1 degree C per decade over the past 50 years, and is strongest in winter and spring. The image incorporates temperature data collected over a 50-year period from 1957 to 2006 (NASA/GSFC Scientific Visualization Studio 2008)
There is a remarkable difference in observed warming between the West Antarctic Ice Sheet (often referred to as the WAIS) and the East Antarctic Ice Sheet, which so far has remained relatively unaffected, largely due to the cooling effects of the ozone hole (Thompson A. 2009). However, the WAIS, which includes the Antarctic Peninsula, has experienced a significant warming trend, with average temperatures rising by nearly 3°C in the west coast of the Peninsula (approximately 10 times the average global warming rate). Also, in the last 50 years upper ocean temperatures to the west of the Antarctic Peninsula have increased by over 1°C and 87% of glaciers along the west coast of the Peninsula have retreated. (NERC-BAS 2007; IPCC 2007). In 2002 the Larsen ice shelf collapsed completely (NERC-BAS 2007).
The West Antarctic Ice Sheet is much less stable than East Antarctica because it sits on rock below sea level and observations that large areas of the WAIS are thinning fast may indicate the ice sheet’s collapse. (NERC-BAS 2007a). Evidence that the WAIS is losing mass at an increasing rate comes from the Amundsen Sea sector and in particular from three glaciers: Pine Island, Thwaites and Smith. Total ice discharge from these glaciers increased 30% in 12 years and the net mass loss increased 170% (Rignot E. 2008). Ice shelf collapses could precede the West Antarctic Ice Sheet collapse which would eventually cause an average global sea level rise of about 5 meters (Bentley C.R. 1998) and would have profound ecological, social and economic impacts worldwide. Increased emissions of atmospheric CO2 and projected intense winds and changes in stratification will alter rates of atmospheric CO2 draw-down in the Southern Ocean (in the last 20 years it has dropped up to 30%).
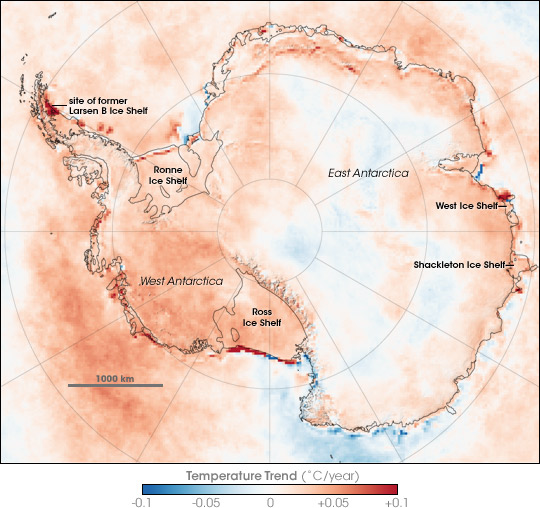
Figure 13.Temperature trends in Antarctica between 1981 and 2007, based on thermal infrared observations made by a series of NOAA satellite sensors. Author: Robert Simmon, NASA Earth Observatory.
The situation is very different for Antarctic sea ice which, due to the regional climate dynamics, is generally unchanged or actually increasing. For example, the NOOA 2012 state of the Climate report (NOOA 2013) confirmed that in 2012 Antarctica sea ice extent reached record high of 7.51 million square miles on September 26 2012. However, the longer term viability of Antarctic sea ice is linked to the fate of the ice sheets and wider global warming impacts (Hansen et al 2013).