The degradation of the cryosphere in general and the poles in particular will have increasingly severe repercussions over the rest of the world. Ice melting is leading to increasing amounts of CO2 and methane being released from melting permafrost which in turn is further enhancing the greenhouse effect. The retreat of ice in the polar and other cryosphere regions, in addition to tree line shifts will greatly reduce albedo which will generate strong positive feedbacks causing further warming. Any changes in the ocean circulation system will have further consequences for further climate change in addition to potentially severe effects on marine ecosystems. Ice melting increases sea levels with repercussions on many low-land and coastal areas. Biodiverstiy will be threatened by loss of habitats and alien species invasion, involving significant changes in the abundance and distribution of species.
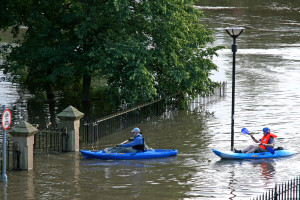
© Michael Wilson, Creative Commons
Projected sea level rise will increasingly impact coastal environments, including the salinity of estuaries and aquifers.(Titus J. 2008), with severe socio-economic and ecological implications. Although some of the most vulnerable regions in South, South-east and East Asia, Africa and low-land islands will be among the first affected (IPCC 2007) almost all costal environments and human settlements (including many of the world’s major cities) will be increasingly threatened (World Bank 2012; Hallegatte et al 2013).
3.1 The take home message
The polar regions are critically important systems, both for their dependent biodiversity and for the key role they play in maintaining the stable climate and sea levels we all rely on. They also exemplify the highly interconnected nature of our planet’s physical and living systems and how vulnerable we all are to even current levels of global warming (AMAP 2012; Whiteman et al 2013).
In the case of the Arctic there’s increasing concern that the region may already be entering a state of committed change which would eventually cause all of its sea ice, ice sheets and permafrost to be lost. The same concern pertains to the West Antarctic Ice Sheet, although, as with Greenland, the huge amounts of ice involved means that complete collapse could take several centuries, and quite possibly millennia in the case of East Antarctica. However, once sufficient ice-melt momentum has been reached there would be no practical way for humanity to halt the disintegration process. Moreover, the impacts of even relatively modest levels of ice sheet disintegration on sea levels is such that well within this century the threat to marine and terrestrial ecosystems and our own coastal settlements, including many of the world’s major cities, will become increasingly unmanageable.
The already observed impacts on the polar regions and the fact that a lot more ‘committed’ warming responses are in the pipeline, due to combined effects of climate system inertia and the delayed response of ice sheets (Hansen 2012; Hansen et al 2013) means that we are now faced with this critical threshold risk. Unless we act now to ensure that atmospheric concentrations of carbon dioxide are returned to below 350 parts per million in the short window of time remaining for this to be still possible, humanity will be committed to the fate of tens of meters of sea level rise and the plethora of extreme climate and ocean acidification conditions summarized in the Met Office 4oC world map below.
The 2012 emergency resolution by the World Association of Zoos (included in full at the end of this chapter) highlights the threat to the Arctic and the associated global scale ramifications this has for disastrous and unmanageable climate change and ocean acidification. It also details the essential mitigation actions that must be taken if we are to avoid this fate. It’s these realities that are the catalyst for our community’s Pole2Pole campaign.
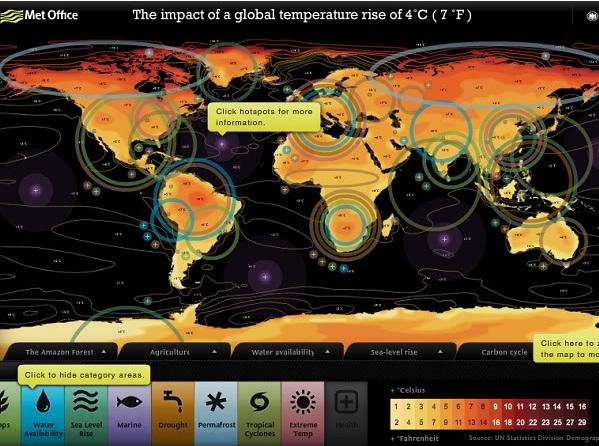
Figure 15. This 4°C average global warming map shows the far higher regional warming that the polar regions would be subjected to (AVOID 2009). High resolution and interactive versions of this map can be obtained from the UK Met Office