Extensive studies (IPCC 2007; World Bank 2010; AMAP 2012) continue to document a general worldwide glacier degradation trend which has accelerated over the past two decades. Based on highly accurate satellite mass balance measurements of more than 300 glaciers (including glaciers in the Arctic) glaciers worldwide are estimated to have lost 219 ± 112 kg m−2 per year between 1961-1990, which more than doubled to a loss of 510 ± 101 kg m−2 per year between 2001-2004. Large and accelerating mass loss from Alaskan glaciers with 98% of these glaciers thinning and/or retreating (Arendt et al., 2002).
It is projected that glaciers and ice caps, including those surrounding the ice sheets, will contribute 10-25 cm of sea level rise by 2100 (Meier et al. 2007). Glaciers in the Arctic, apart from those in Alaska, are not among the highest in terms of mass loss per unit area, although their large areas mean that they will be among the biggest contributors to sea-level rise (Romanovsky et al. 2007; WWF 2008). Observations of ocean-terminating outlet glaciers in Greenland and West Antarctica indicate that their contribution to sea level is accelerating as a result of increased velocity, thinning and retreat (Rignot et al 2008; Vieli et al 2009; King et al 2012; Shepherd et al 2012 and Zwally et al 2011). Thinning has also been reported along the margin of the much larger East Antarctic ice sheet (Pritchard et al 2009). The most recent study confirms significant East Antarctic glacier impacts, especially along the warmer western South Pacific coast and concludes that parts of the world’s largest ice sheet may be more vulnerable to warming air and oceans than previously recognised (Miles et al 2013).
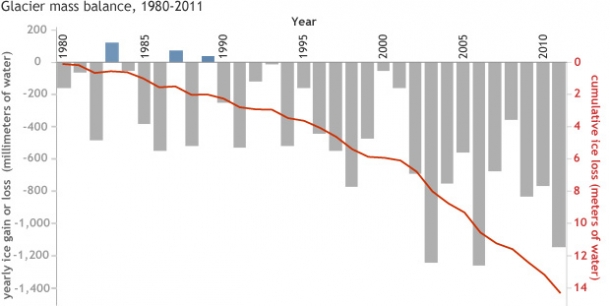
Figure 5. Glacier mass balance (snow gain minus melt loss) from 1980 through to 2011. Bars indicate positive (above the 0 line) and negative (below the 0 line) glacier mass balances each year, and the red line shows the cumulative annual balance. Only three years – 1983, 1987, and 1989 – experienced mass gains. All other years had negative mass balances with loses getting larger in more recent years. Source NOAA (adapted from the 2012 BAMS State of the Climate report)
Find out more:
- AMAP, 2012. Arctic Climate Issues 2011: Changes in Arctic Snow, Water, Ice and Permafrost. SWIPA 2011 Overview Report. AMAPs 2011 assessment of the Arctic Cryosphere (the SWIPA assessment) updates information presented in the 2004/5 Arctic Climate Impact Assessment.
- Arendt et al. 2002. Rapid Wastage of Alaska Glaciers and Their Contribution to Rising Sea Level Science 297 no. 5580, pp. 382 – 386. (Abstract)
- IPCC fourth assessment report: Climate Change 2007. Working Group I Report “The Physical Science Basis”, Ch 4 Observations: Changes in Snow, Ice and Frozen Ground. (Report)
- IPCC Fourth Assessment Report: Climate Change 2007. Working Group II Report “Impacts, Adaptation and Vulnerability” Ch 1: Assessment of Observed Changes and Responses in Natural and Managed Systems. (Report)
- NASA
- National Snow and Ice Data Centre (NISDC)
- World Bank (2010) Turn down the Heat. Why a 4 degree centigrade warmer world must be avoided.