Since 1979, winter Arctic ice extent has decreased about 3 to 4 percent per decade (Meier et al. 2006).. In 2007 the minimum ice sea extent was 39% less than the 1979-2000 average and this record was broken again in 2012 (NOOA 2013). Global warming is also affecting the thickness distribution of the Arctic sea ice, where the ice is getting younger and thinner. This means that, at the start of the melting season, open water areas develop earlier and become more extensive through summer. (Serreze & Stroeve 2008) The increased melting of the summer Arctic sea ice is accumulating heat in the ocean, raising the air temperatures in the region (referred to as Arctic amplification). As this was detected much earlier than expected it is thought that the Arctic may already have passed the climatic tipping-point towards ice-free summers. (Connor S. 2008 Lenton 2008; Lenton et al 2011) Projections suggest that an acceleration of the trend may be especially pronounced, appearing as an abrupt transition to ice-free summer conditions possibly in few decades (Serreze & Stroeve 2008)
Meanwhile overall sea ice cover in Antarctica has grown which, as the National Snow and Ice Date Center (NISDC) explains, is due the fact that both global warming and ozone loss (i.e. the slowly repairing ozone hole over the Antarctic) act to strengthen the circumpolar winds in the south. This is due primarily to persistently cold conditions prevailing on Antarctica year-round, and a cold stratosphere above Antarctica due to the ozone hole. Stronger winds generally act to blow the sea ice outward, slightly increasing the extent, except in the Antarctic Peninsula region, where due to geography; winds from the north have also increased, pushing the ice southward. Thus, sea ice extent near the northwestern Antarctic Peninsula continues to decline rapidly, while areas in the Ross Sea and the southern Indian Ocean show significant increases (NISCC 2013 & Stammerjohn et al., 2012).
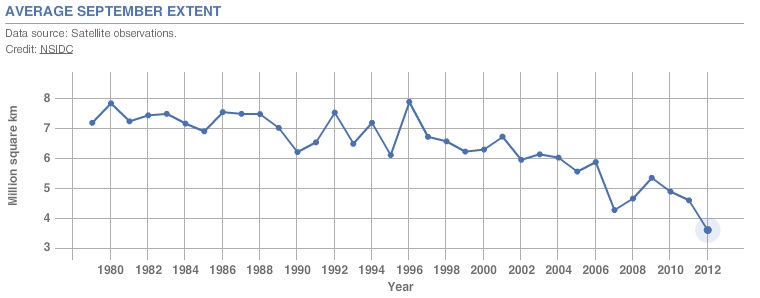
Figure 7. September Arctic sea ice is now declining at a rate of 11.5% per decade, relative to the 1979 to 2000 average. Arctic sea ice reaches its minimum each September. The graph above shows the average monthly Arctic sea ice extent in September from 1979 to 2012, derived from satellite observations. The September 2012 extent was the lowest in the satellite record. National Snow and Ice Data Centre and NASA
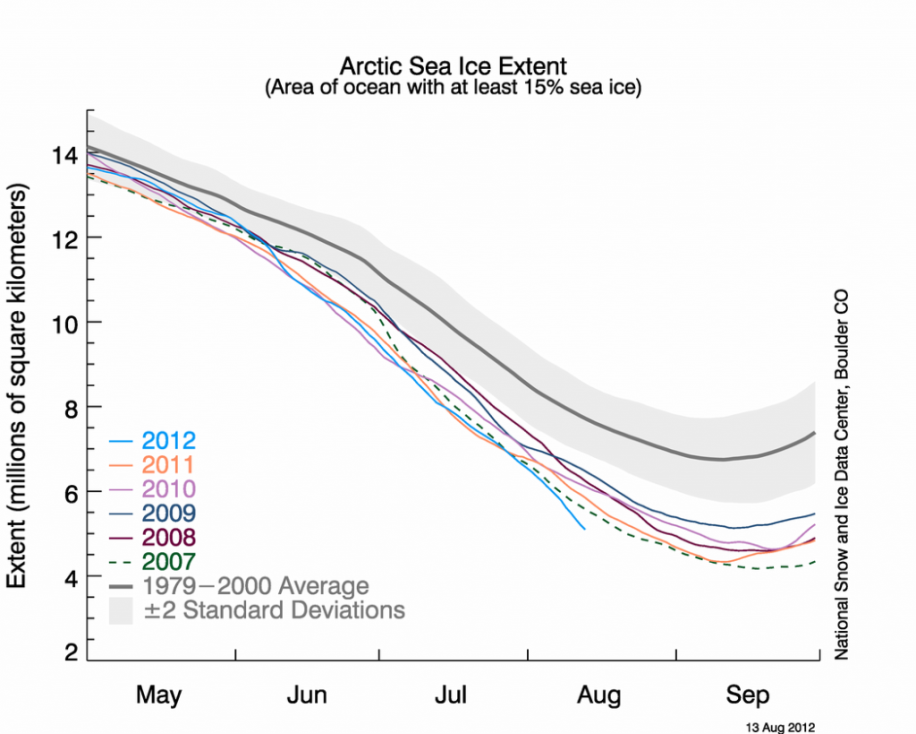
Figure 8. Sea ice extent reached a new record low on August 27, 2012 and continued to decline. The last six years have seen minimum sea ice extents below the two standard deviation range of the data. The graph above shows Arctic sea ice extent as of August 13, 2012, along with daily ice extent data for the previous five years. 2012 is shown in blue, 2011 in orange, 2010 in pink, 2009 in navy, 2008 in purple, and 2007 in green. The gray area around the average line shows the two standard deviation range of the data. National Snow and Ice Data Center
Find out more:
- AMAP. (2011) Snow, Water, Ice and Permafrost in the Arctic (SWIPA): Climate Change and the Cryosphere. Arctic Monitoring and Assessment Programme (AMAP), Oslo, Norway. Xii + 538pp.
- AMAP, 2012. Arctic Climate Issues 2011: Changes in Arctic Snow, Water, Ice and Permafrost. SWIPA 2011 Overview Report. AMAPs 2011 assessment of the Arctic Cryosphere (the SWIPA assessment) updates information presented in the 2004/5 Arctic Climate Impact Assessment.
- NSIDC (National Snow and Ice Data Centre
- Meier, W.N., J.C. Stroeve, and F. Fetterer. 2006. Whither Arctic sea ice? A clear signal of decline regionally, seasonally and extending beyond the satellite record. Annals of Glaciology 46: 428-434
- NASA
- National Snow and Ice Data Centre (NISDC)
- NOOA (National Oceanic and Atmospheric Adminstration) State of the Climate in 2012: Highlights
- Stammerjohn et al. (2012) Regions of rapid sea ice change: An inter-hemispheric seasonal comparison. Geophys. Res. Lett., 39, L06501, doi:10.1029/2012GL050874.